UX Research & Design ︎ February-March 2022
USA Rugby - Consolidating and Optimizing the IA of Events-Related Pages
Abstract
USA Rugby is the national governing body of the sport in America. The non-profit organization is hoping to gather behavioral insights and to increase event exposure and to bring together fans of USA Rugby.
In this project, we used Web Analytics, Heatmaps & Scrollmaps to find out the usability problems on event-related pages, and we reorganized the navigation bar and designed a more structured event page to consolidate all the information.
Client
USA Rugby
USA Rugby
Tools
Figma,
Google Analytics,
Hotjar
Figma,
Google Analytics,
Hotjar
Team
Yifan Wang,
Steph Meltzer,
Hao Ni,
Fariah Qasim
Yifan Wang,
Steph Meltzer,
Hao Ni,
Fariah Qasim
Responsibility
UX Researcher and Designer
UX Researcher and Designer

ABOUT THE CLIENT
USA Rugby is the national governing body of the sport in America. The non-profit organization is hoping to gather behavioral insights as the first phase of their digital transformation.
USA Rugby is the national governing body of the sport in America. The non-profit organization is hoping to gather behavioral insights as the first phase of their digital transformation.
Their most highly trafficked site information is the National Events and Match Reports; therefore our goal is to focus on optimizing the upcoming and past archive of events.
Fan attendance at National events is one of their major growth metrics.
OBJECTIVE
- To understand the navigation patterns of USA Rugby users within Events-related pages.
- To increase exposure to upcoming events to promote participation and ticket sales.
- To emphasize the differences between the multiple event pages to improve understandability.
METHODOLOGY
To improve the user experience for Rugby fans, we discussed the following research questions that we can possibly find answers from using Web Analytics (Google Analytics) and Heatmaps & Scrollmaps (Hotjar).
- How do users navigate to the events page?
- How do users navigate to the previous match records?
- How many fans visit the external links to read more information?
- What information are users looking at before visiting external event pages?
- How easily are users able to find recent event statistics?
- What devices do most users access the event pages with?
WEB ANALYTICS
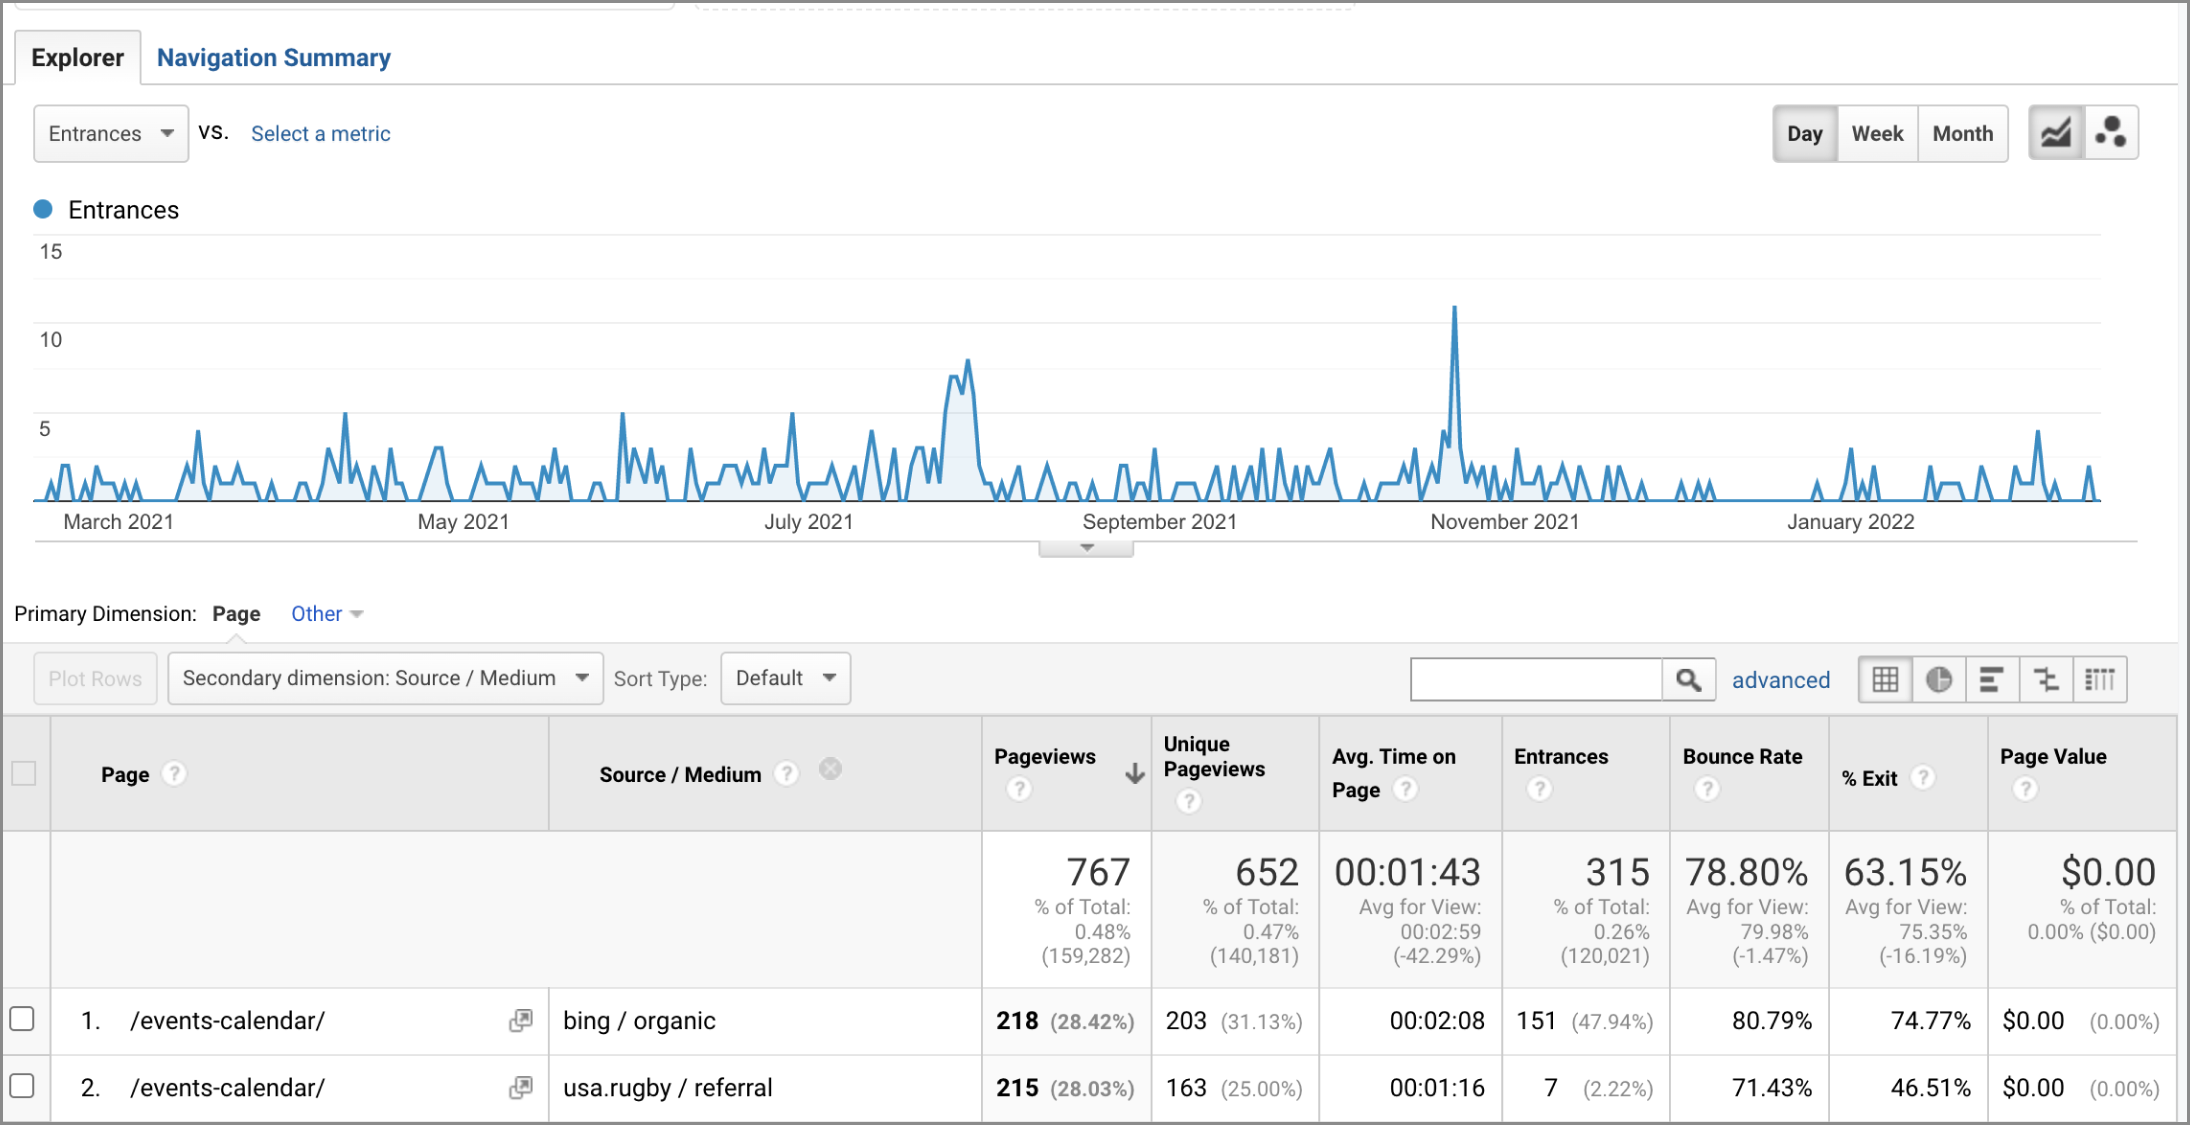
Web Analytics (Google Analytics) Web Analytics is the collection, analysis and reporting of website data (audience, traffic sources, content, conversions) with the purpose of making business decisions.
We studied the data for 1-year-span, from February 14, 2021 - February 14, 2022.
HEATMAPS & SCROLLMAPS
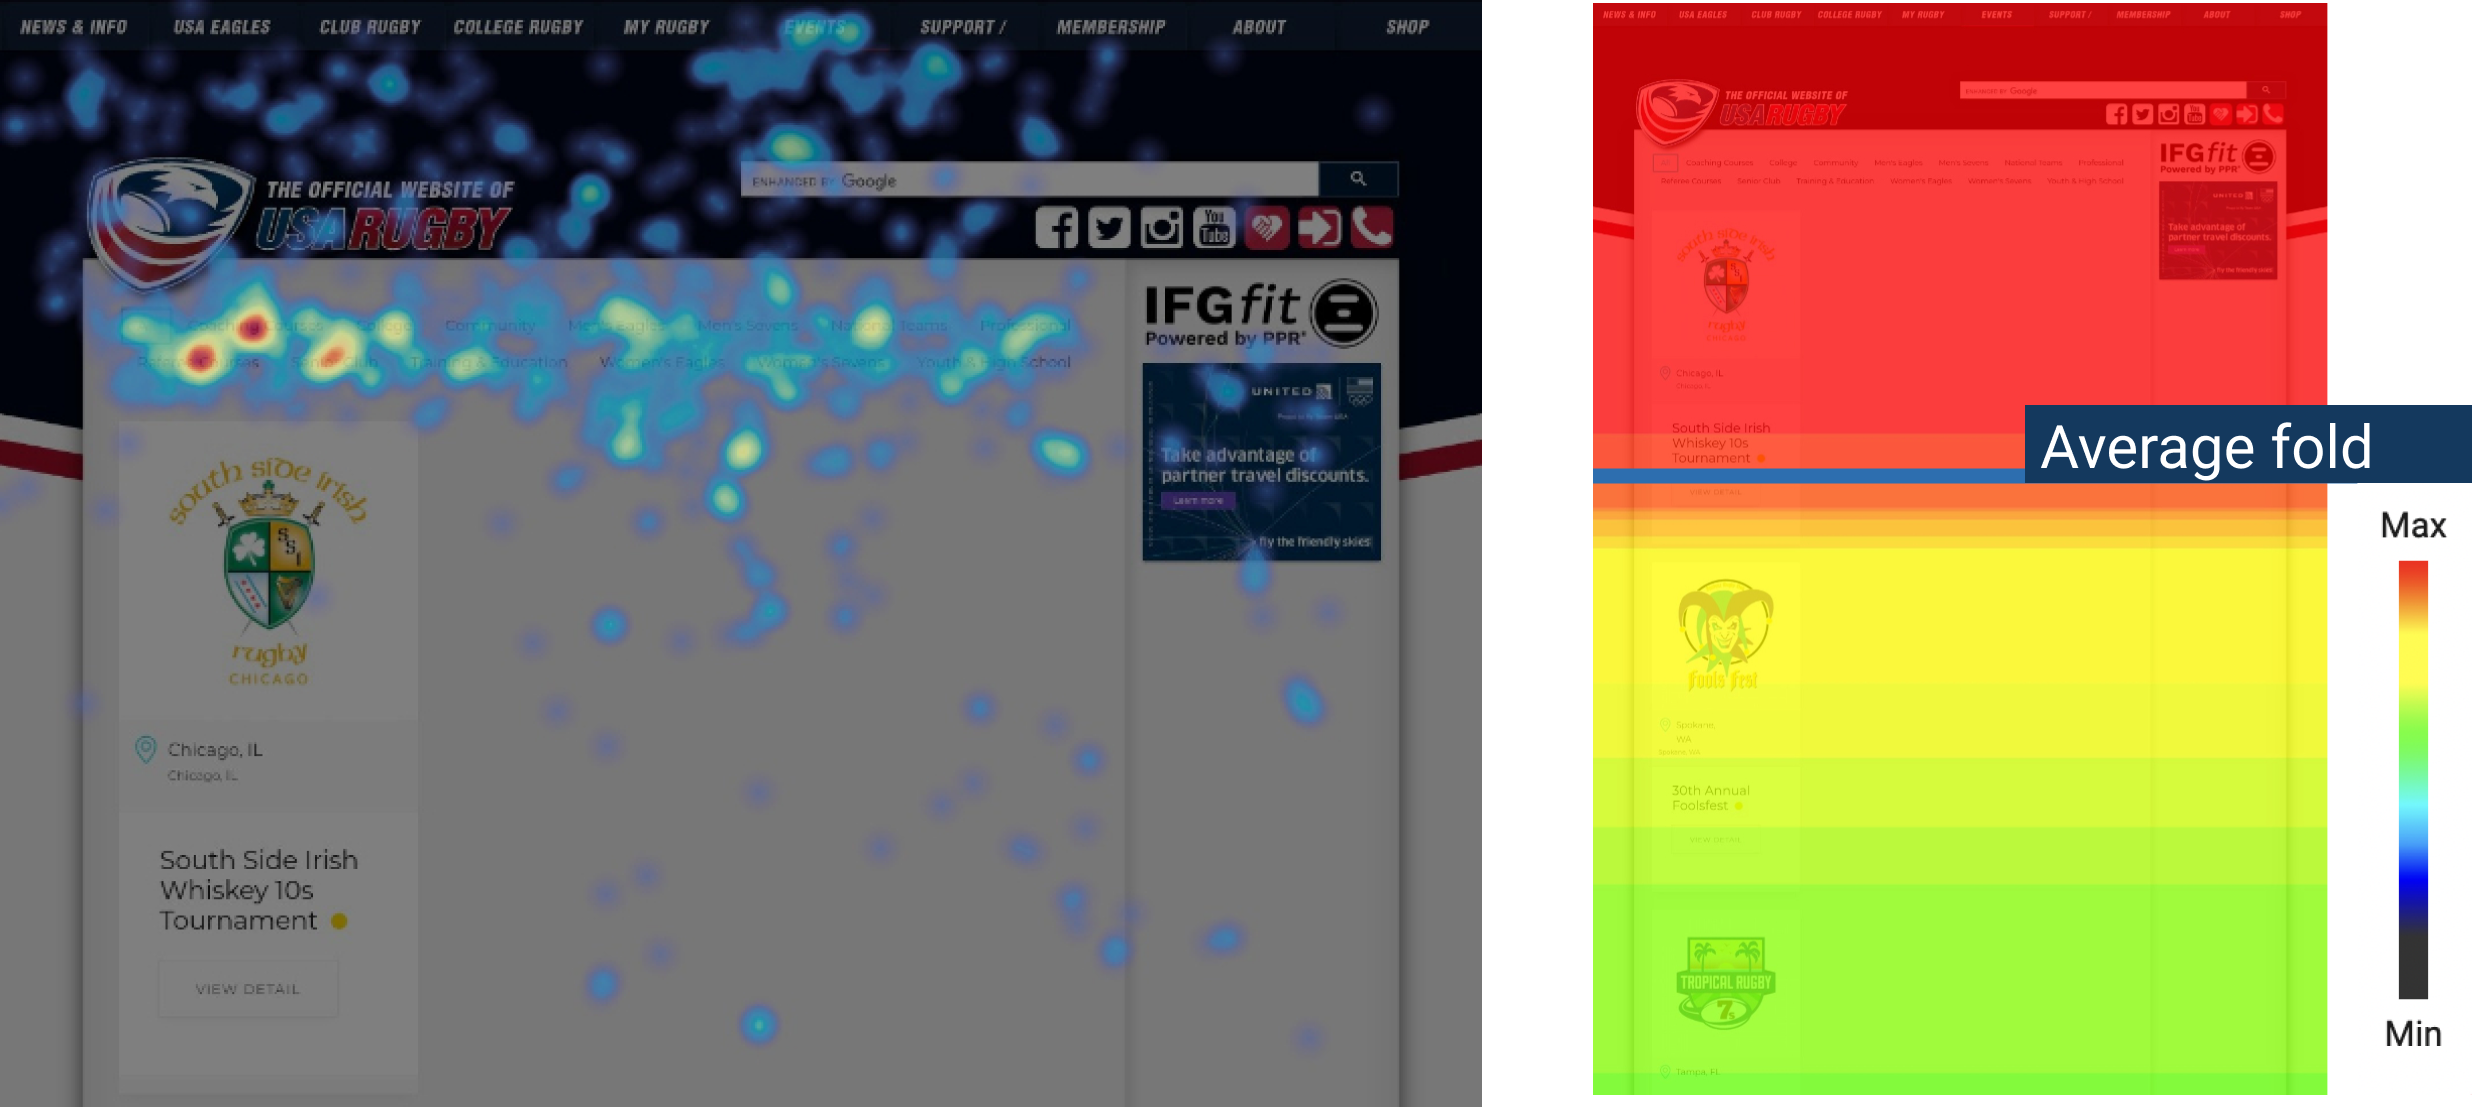
Heatmaps visualize the volume of clicks or mouse movements. The brighter the area, the more popular it is.
Scrollmaps visualize how far most users are scrolling down a page. The most viewed parts of a page are presented in hot colors and the least popular parts in cold colors.
We studied the user activities collected by Hotjar during February 2022.
FINDINGS
WEB ANALYTICS
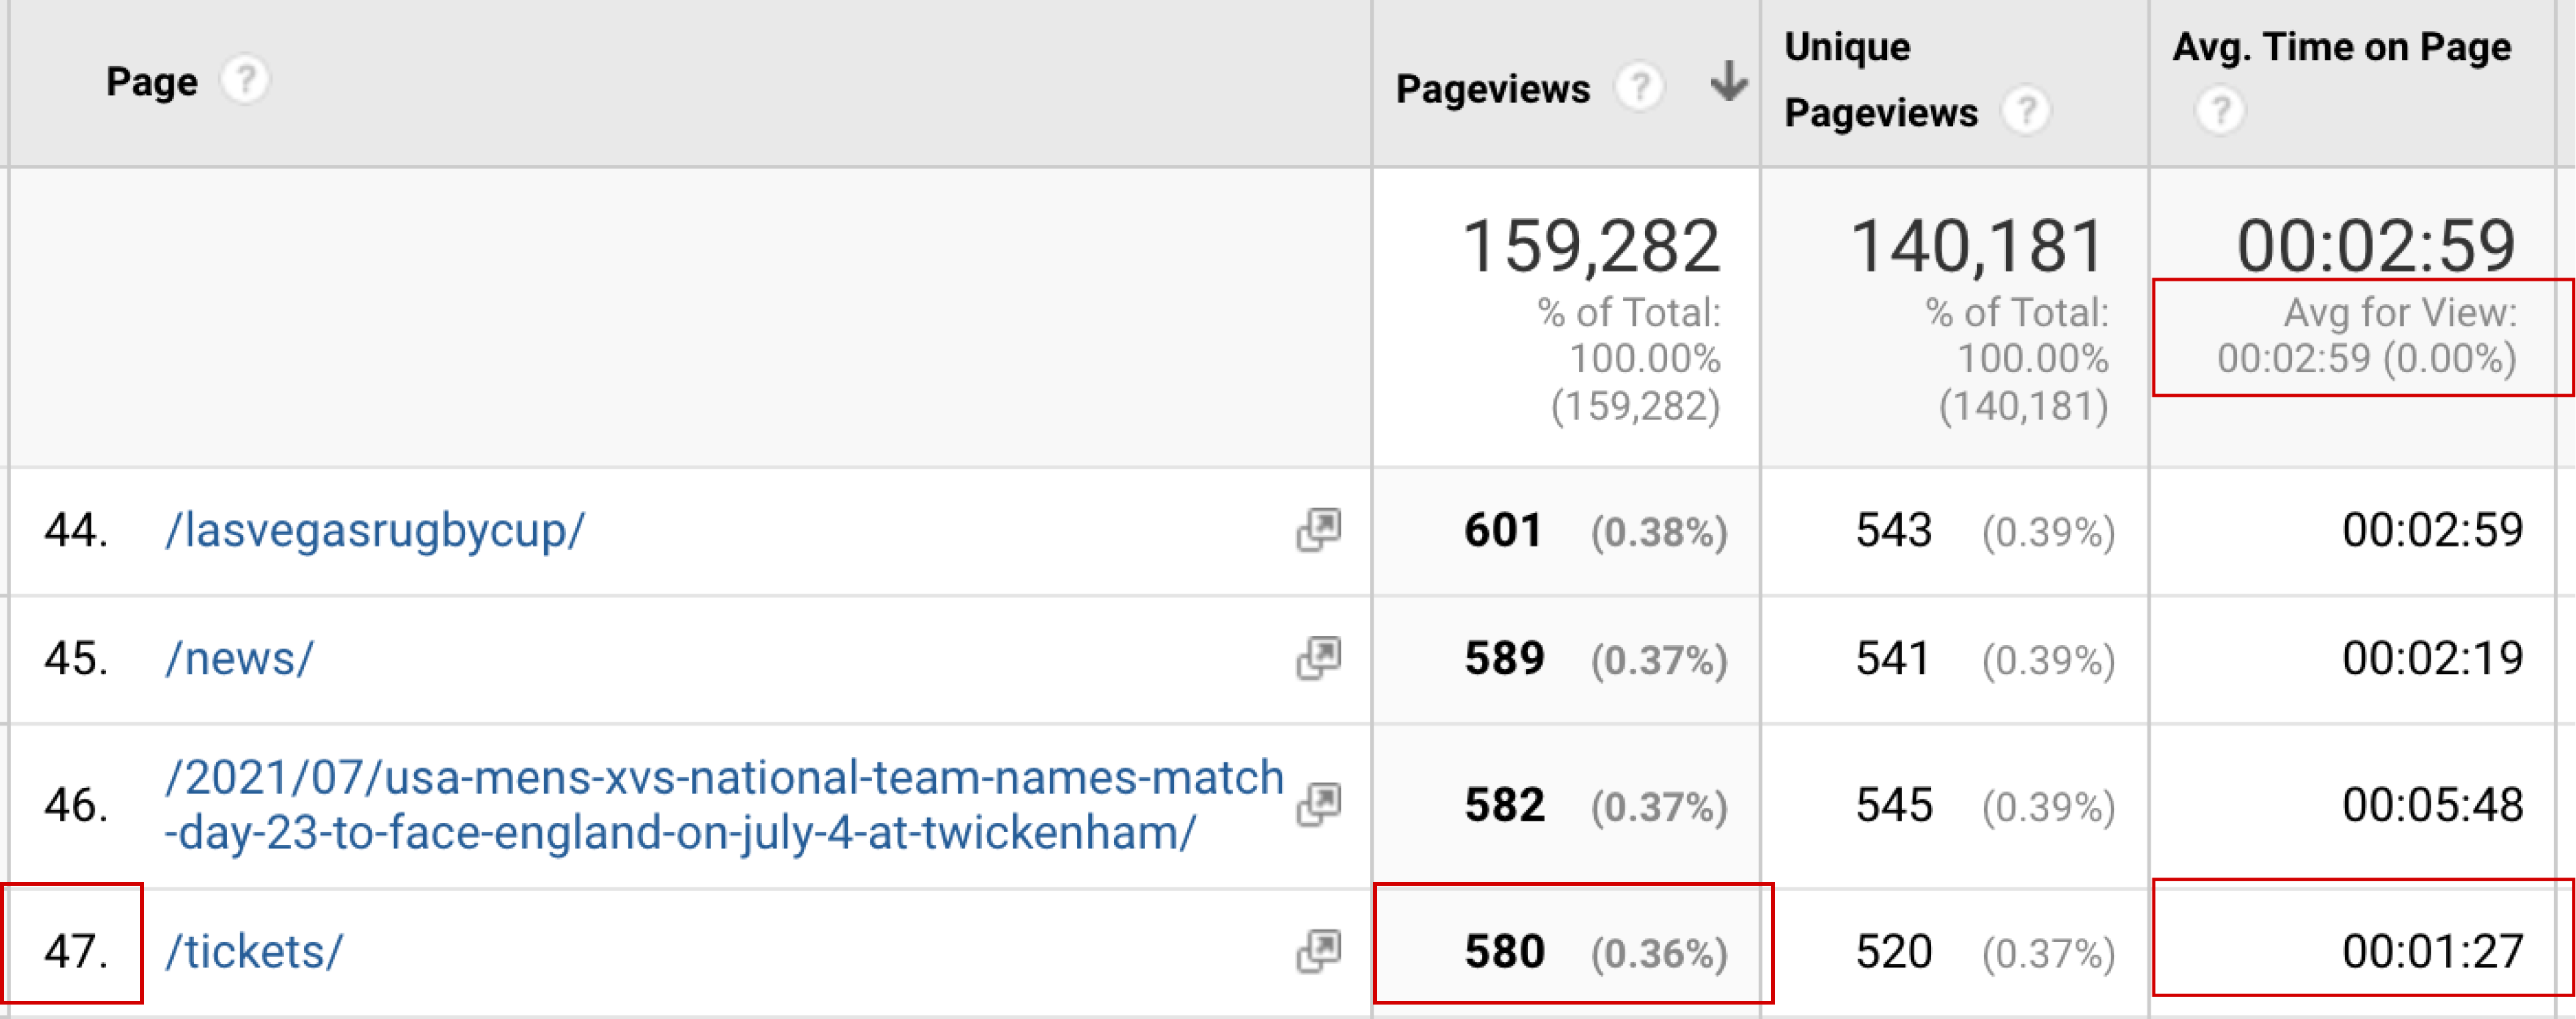
- The pageview ranks at 47 among all pages, the pageview is not high among all pages, but this page is very important for buying tickets.
- The bounce rage is pretty high(87%) and session duration is much lower than average,which means users come and go quickly. This page didn’t provide the information they wanted.
- Users spend less than 50% below average time exploring the /tickets/ page.
*We have bunches of other findings regarding other Rugby fans targeted pages, including the matches record page, but we decided to just focus on the event-related pages for providing recommendations.
HEATMAPS
![]()
![]()
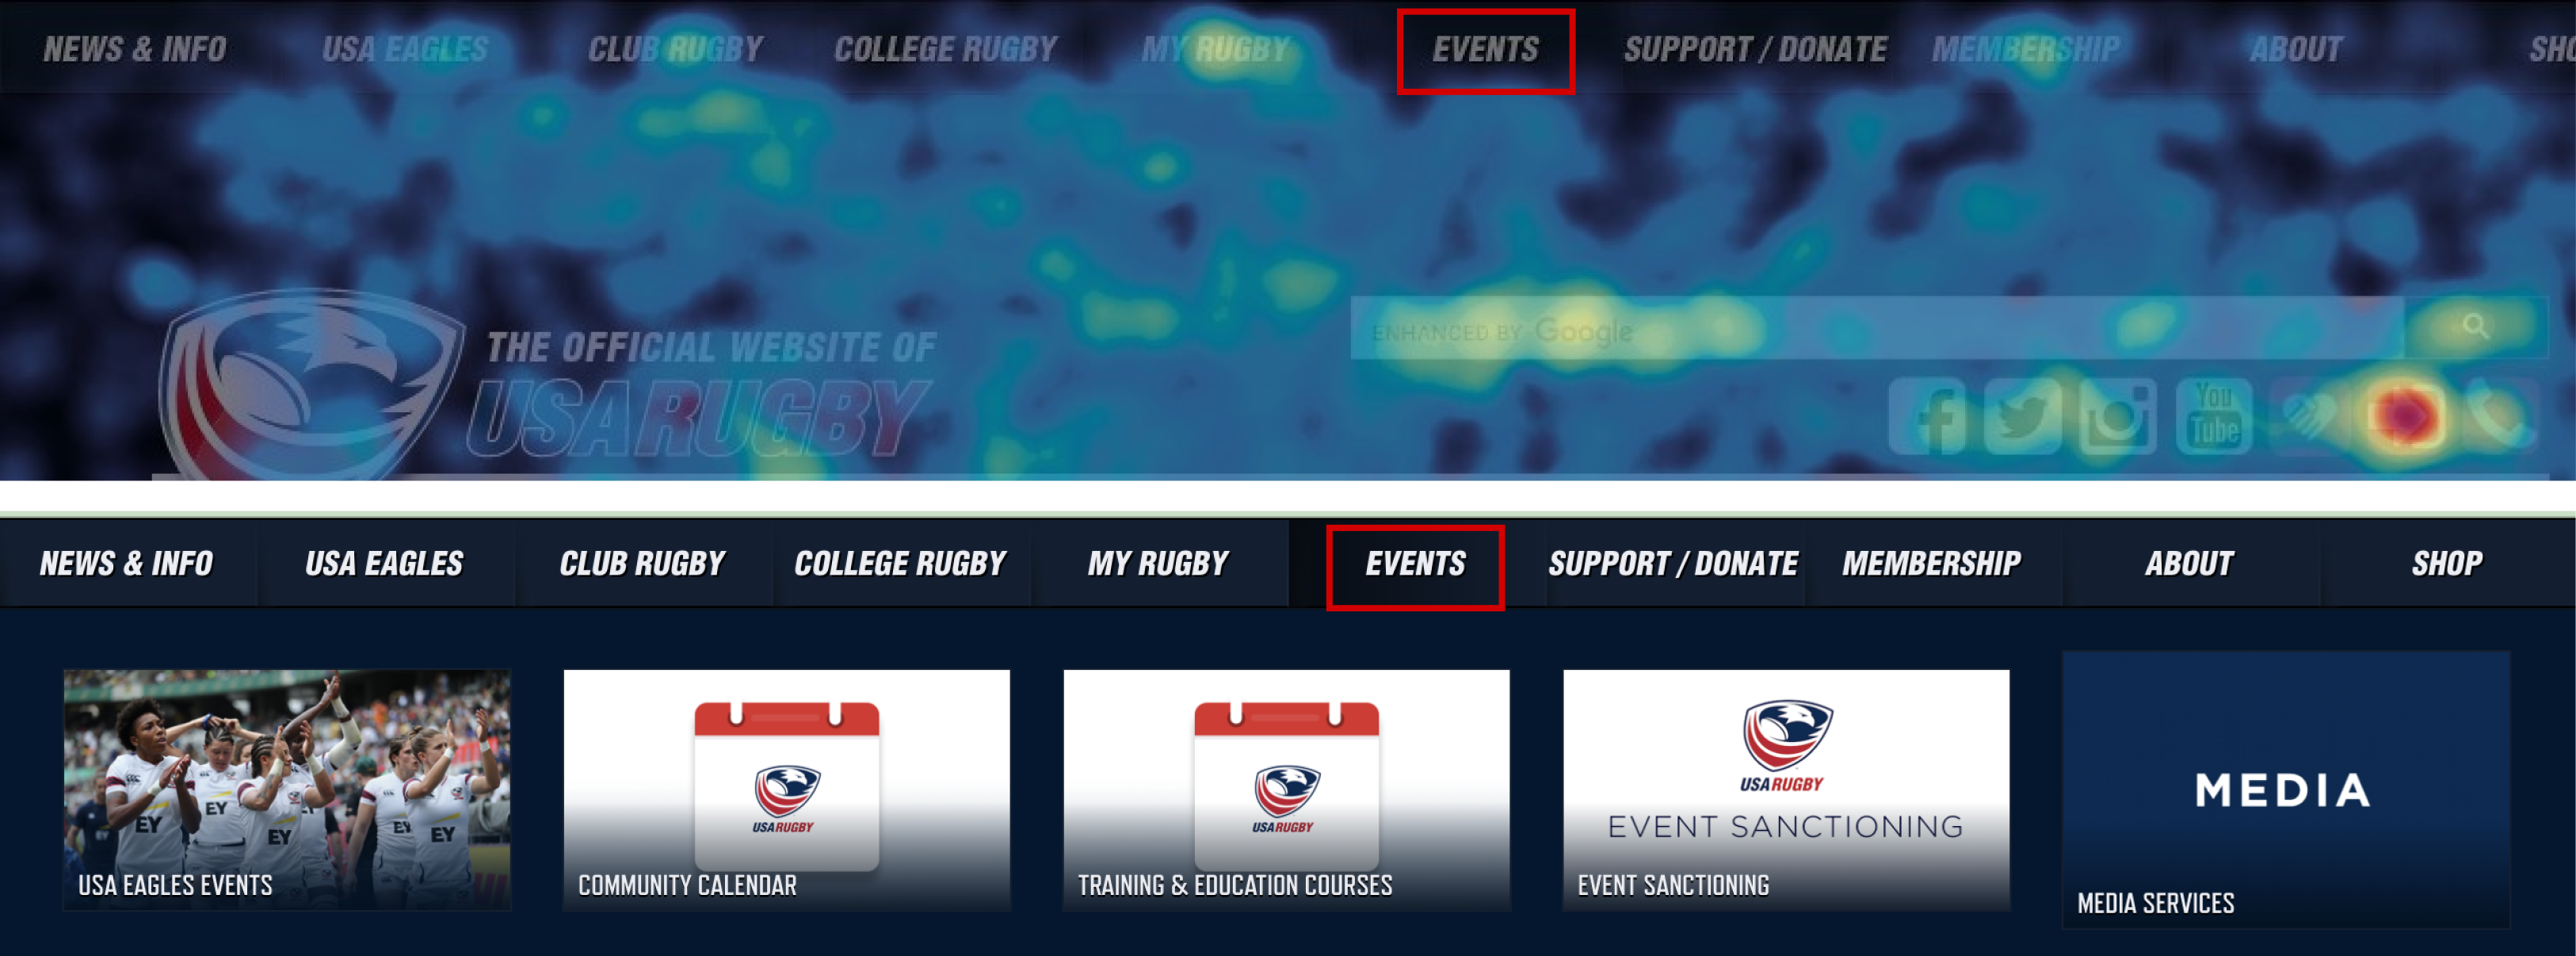
- Users tend to not directly click into “Events“ within the top nav, so they are missing the opportunity to see the /tickets/ page, which combines both Domestic and National events.
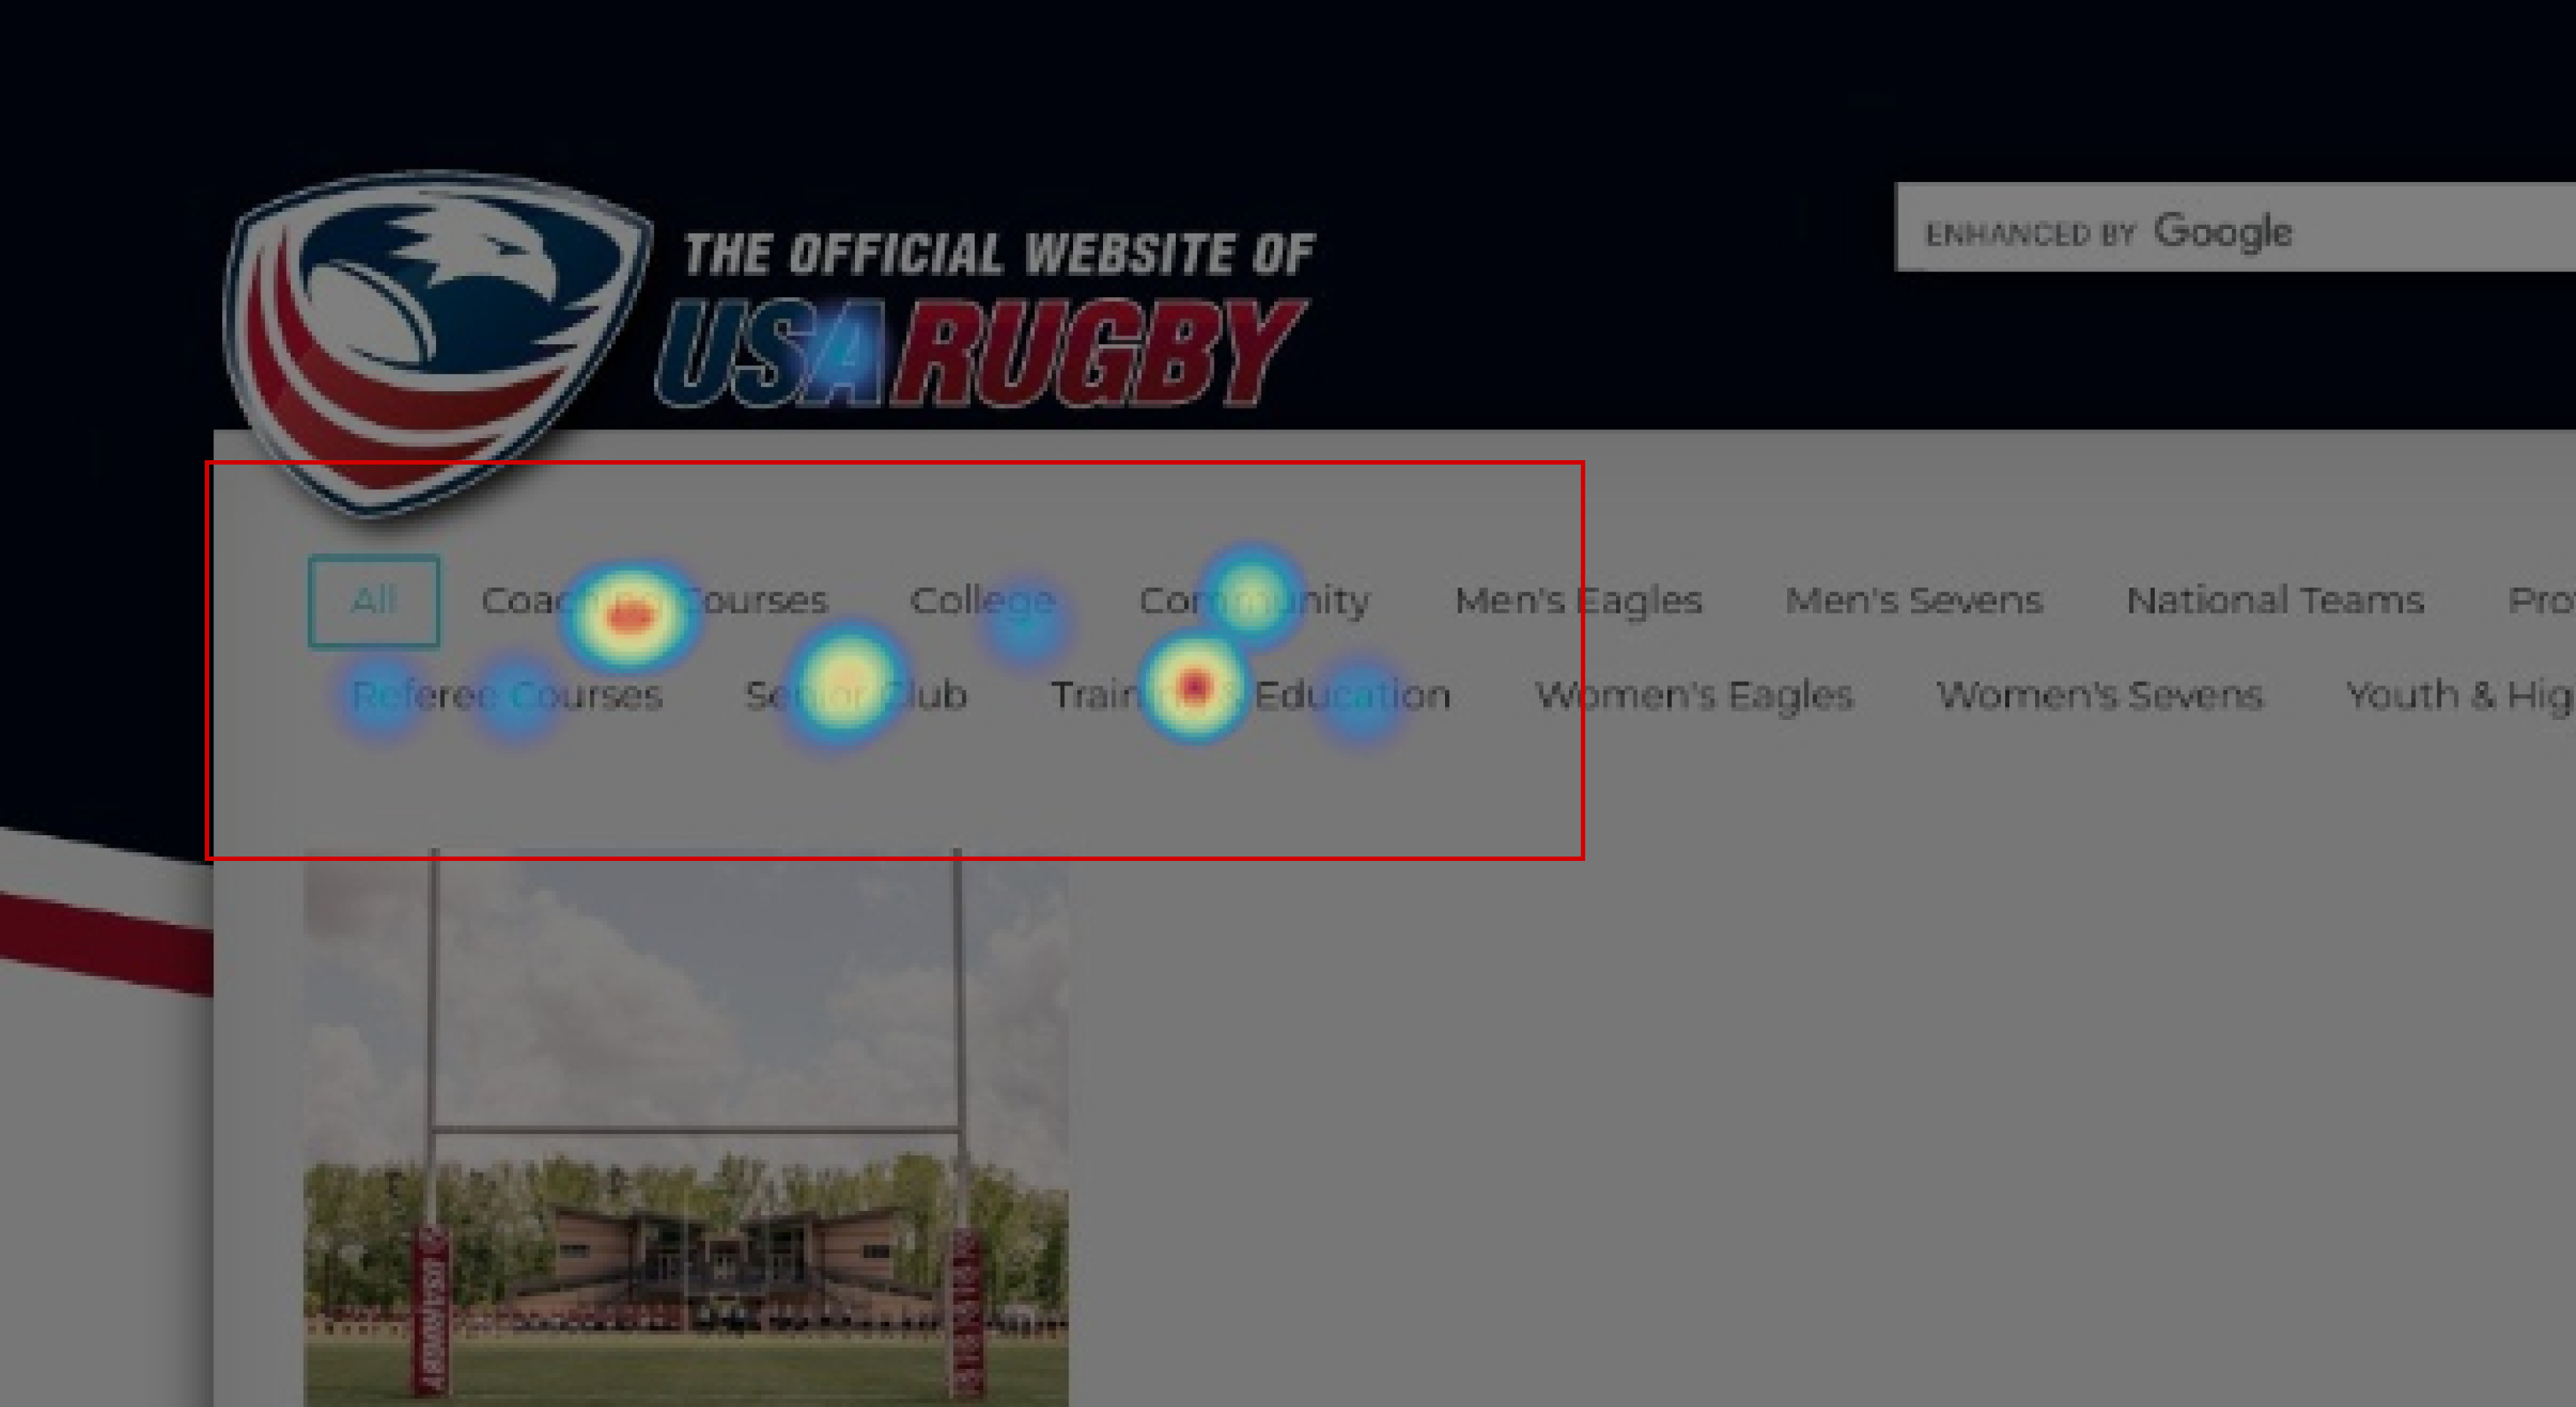
- Click maps reveal that users are attempting to click on the event filters within /tickets/ although many contain no results.
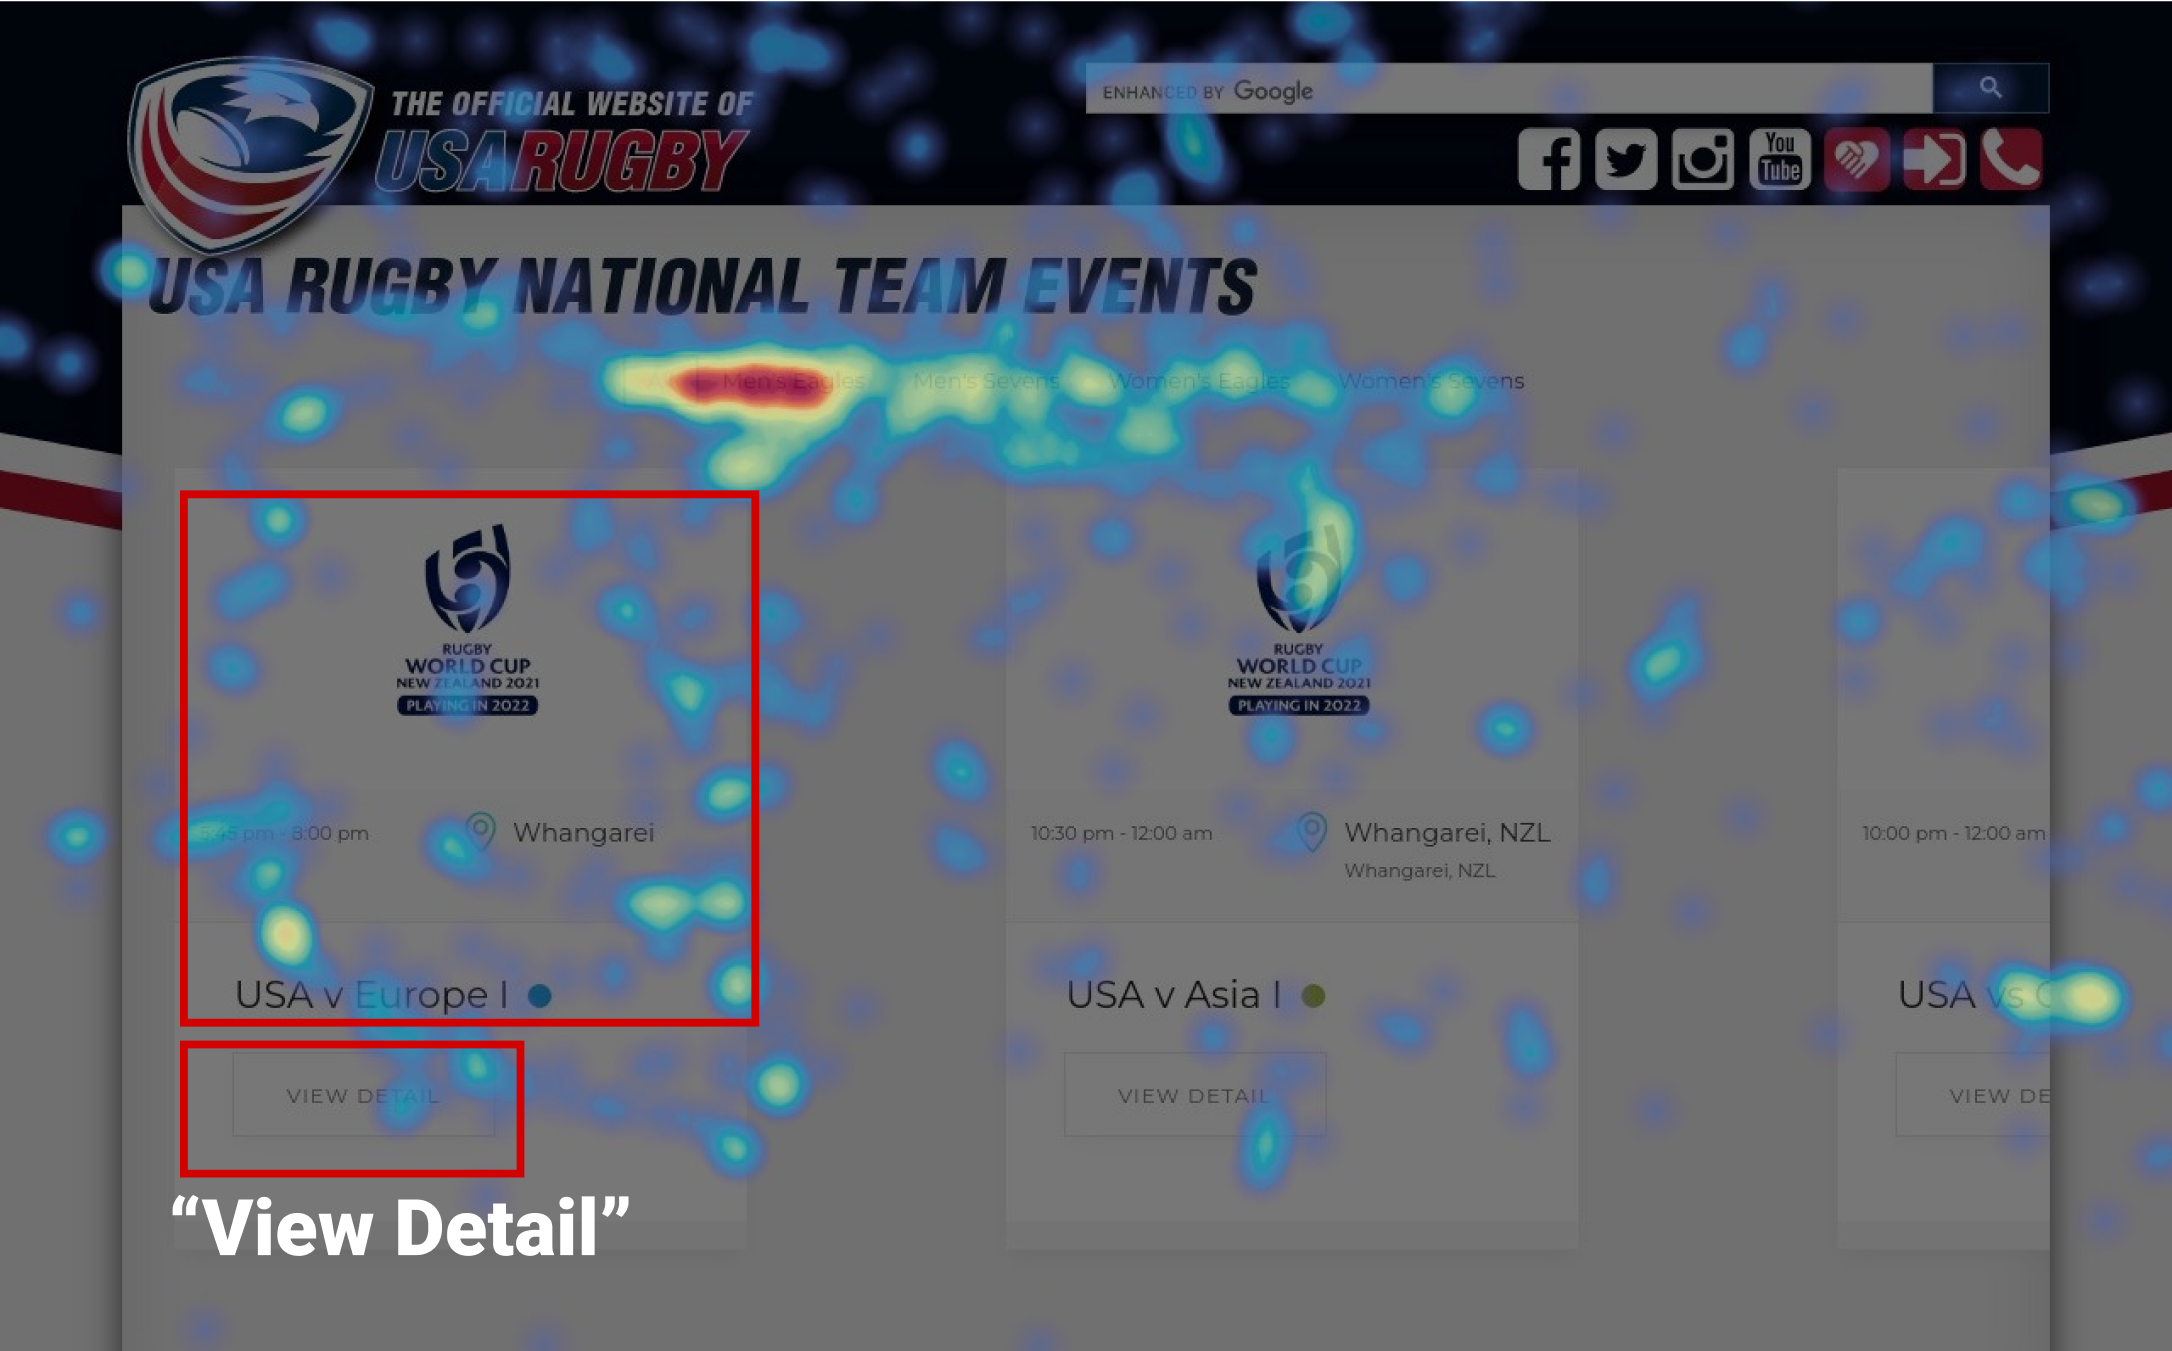
- Move Map results show that users are viewing the information on the event cards. When they click the ‘View Detail’ button, it takes them to a page full of text. On the”View Detail” page, users are browsing through the text. However, many of them are missing the link that will take them to the tickets purchase page.
SCROLLMAPS
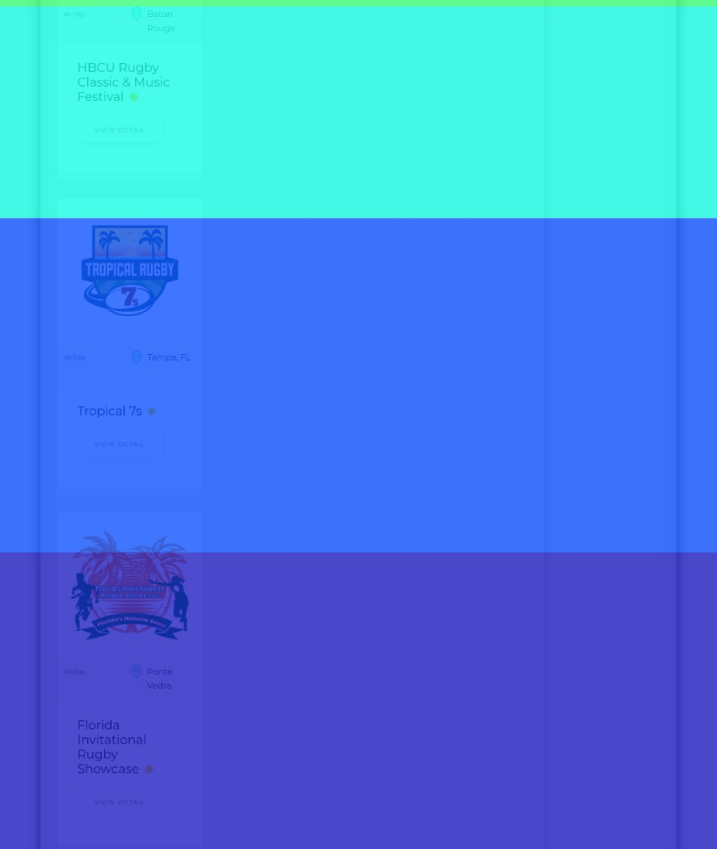
- Scroll maps of the /tickets/ page show that users are not scrolling to the bottom, therefore missing an opportunity to discover all of the events.
- The /tickets/ page presents events in a single column when accessed via desktop, therefore requiring additional time and effort to scroll down.

RECOMMENDATIONS
We found that the current navigation bar and the separated event pages confuse users a lot.
Thus, we reorganized the navigation bar and designed a more structured event page to consolidate all the information.
1. Nagivation Menu Redesign
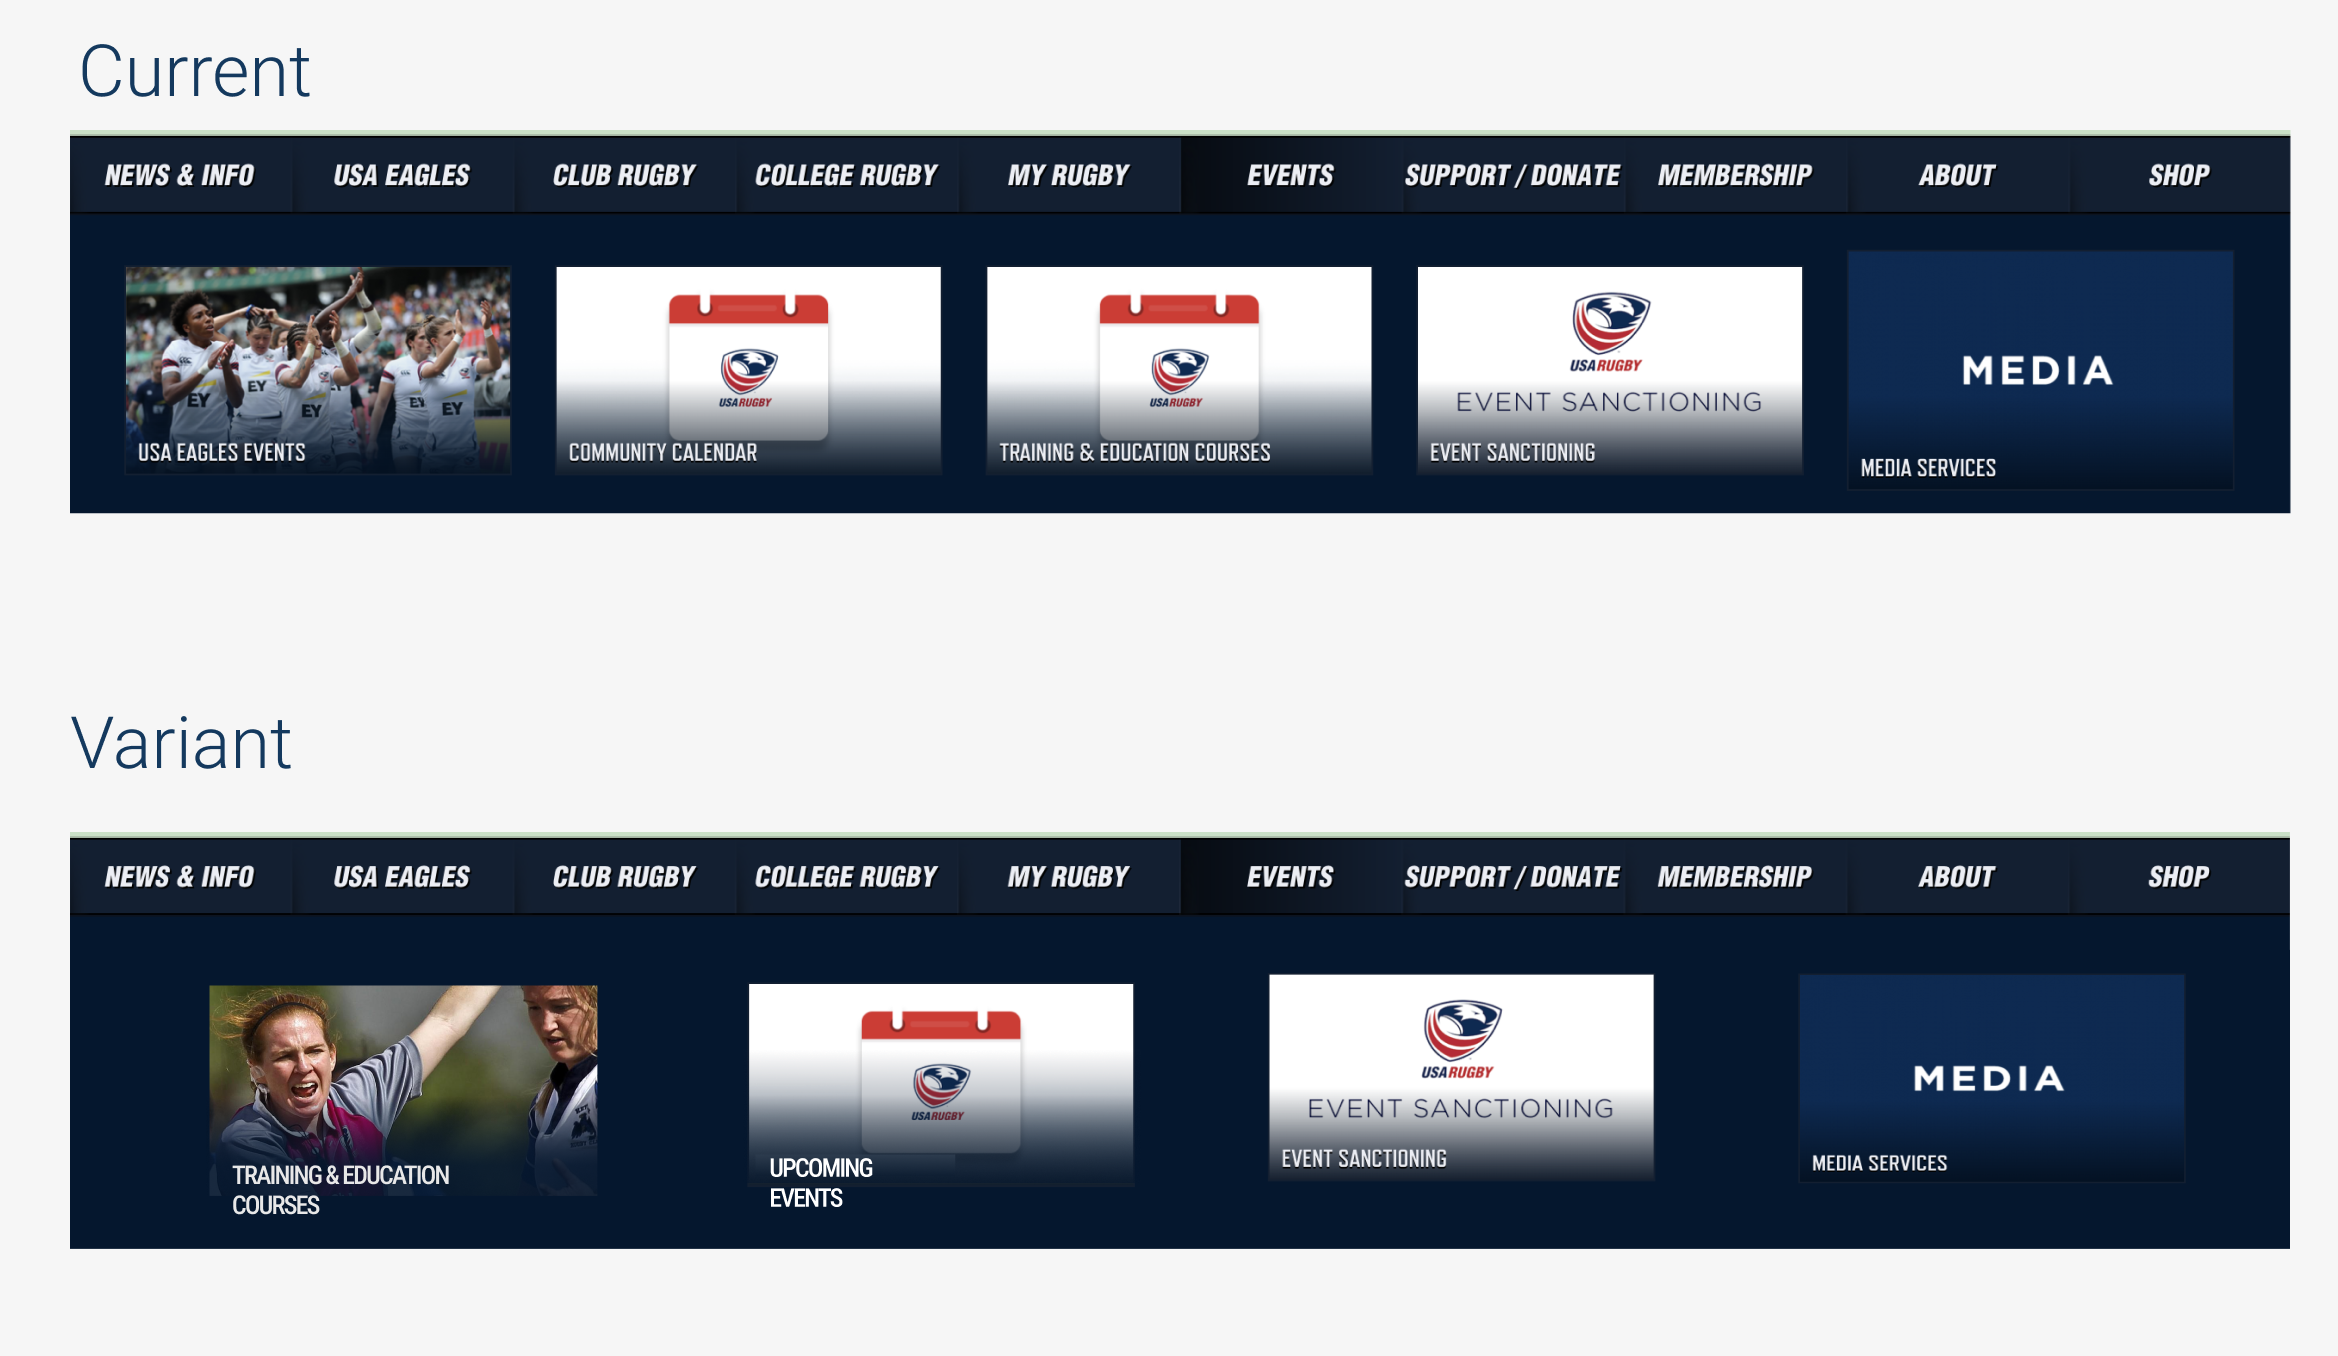
CURRENT NAVIGATION
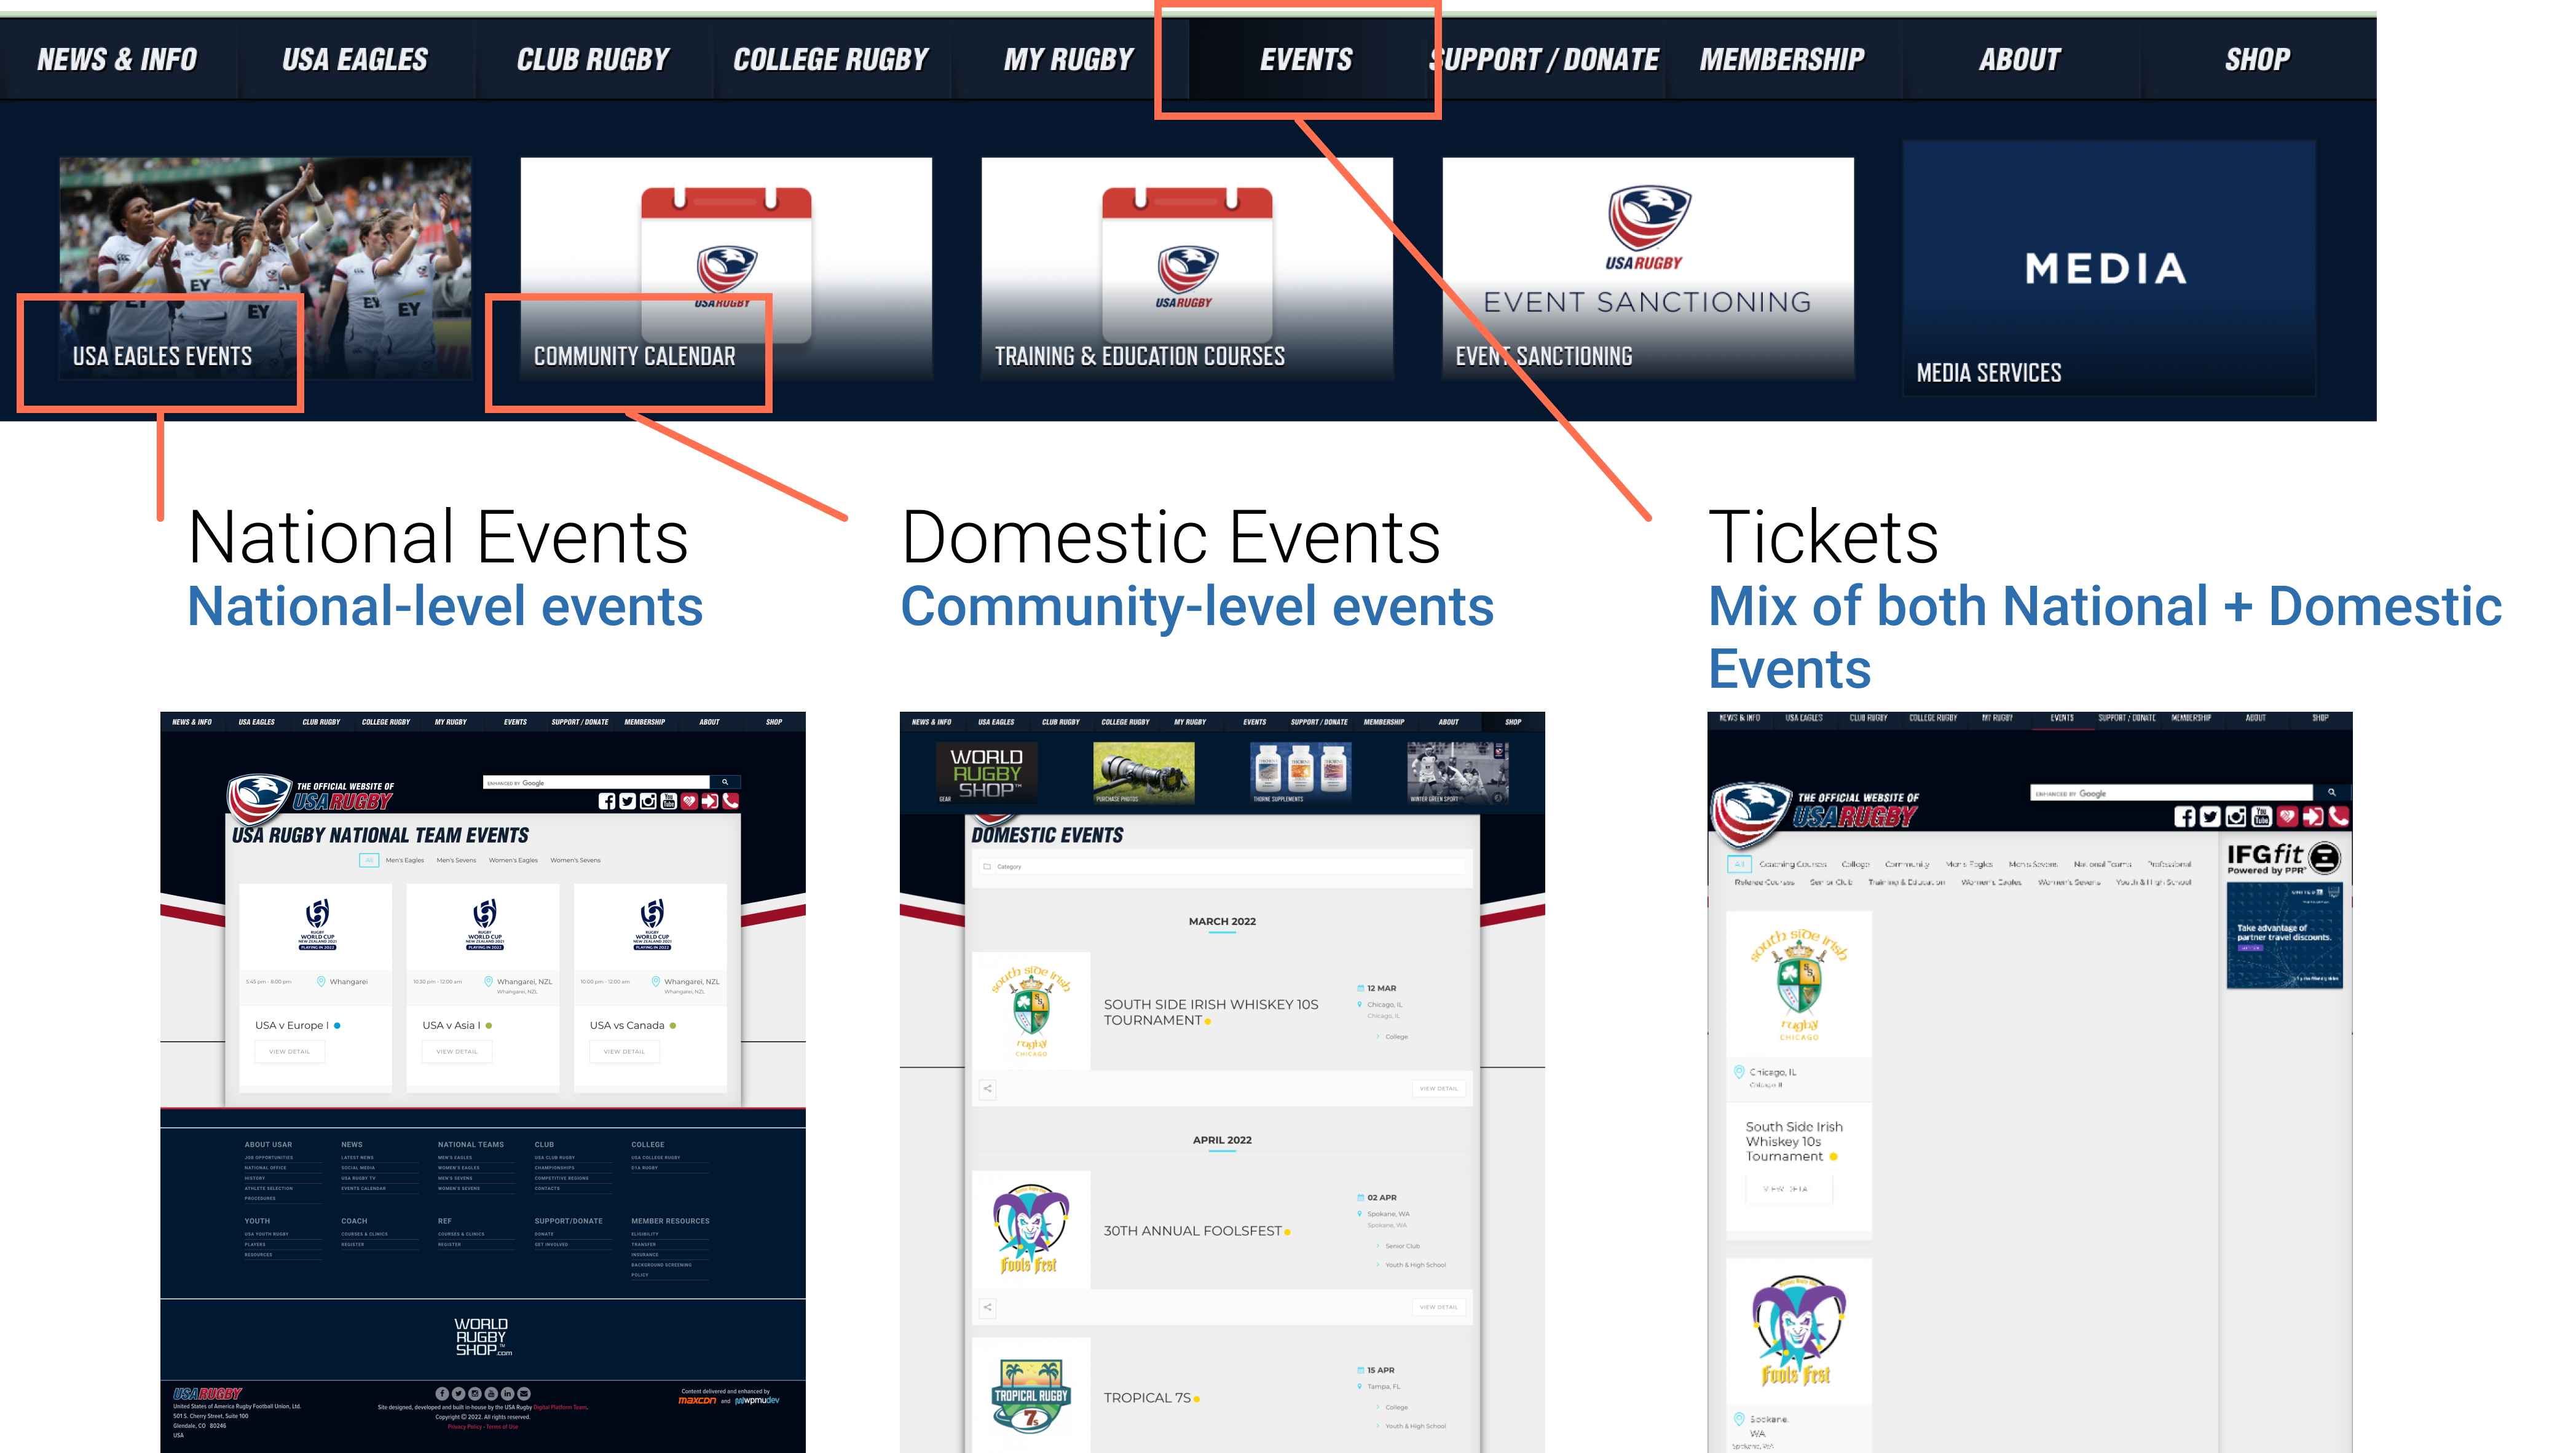
RECOMMEND NAVIGATION
- We revised the navigation bar to combine the "Events", "Domestic Events" (Community-level) , and "National Events" into one page.
- We identified this opportunity to increase exposure to all the events.
- This will provide a more comprehensive calendar-like experience.
- We also recommend this new page would be titled ‘Upcoming Events’ in the navigation to be more consistent with the current page title.

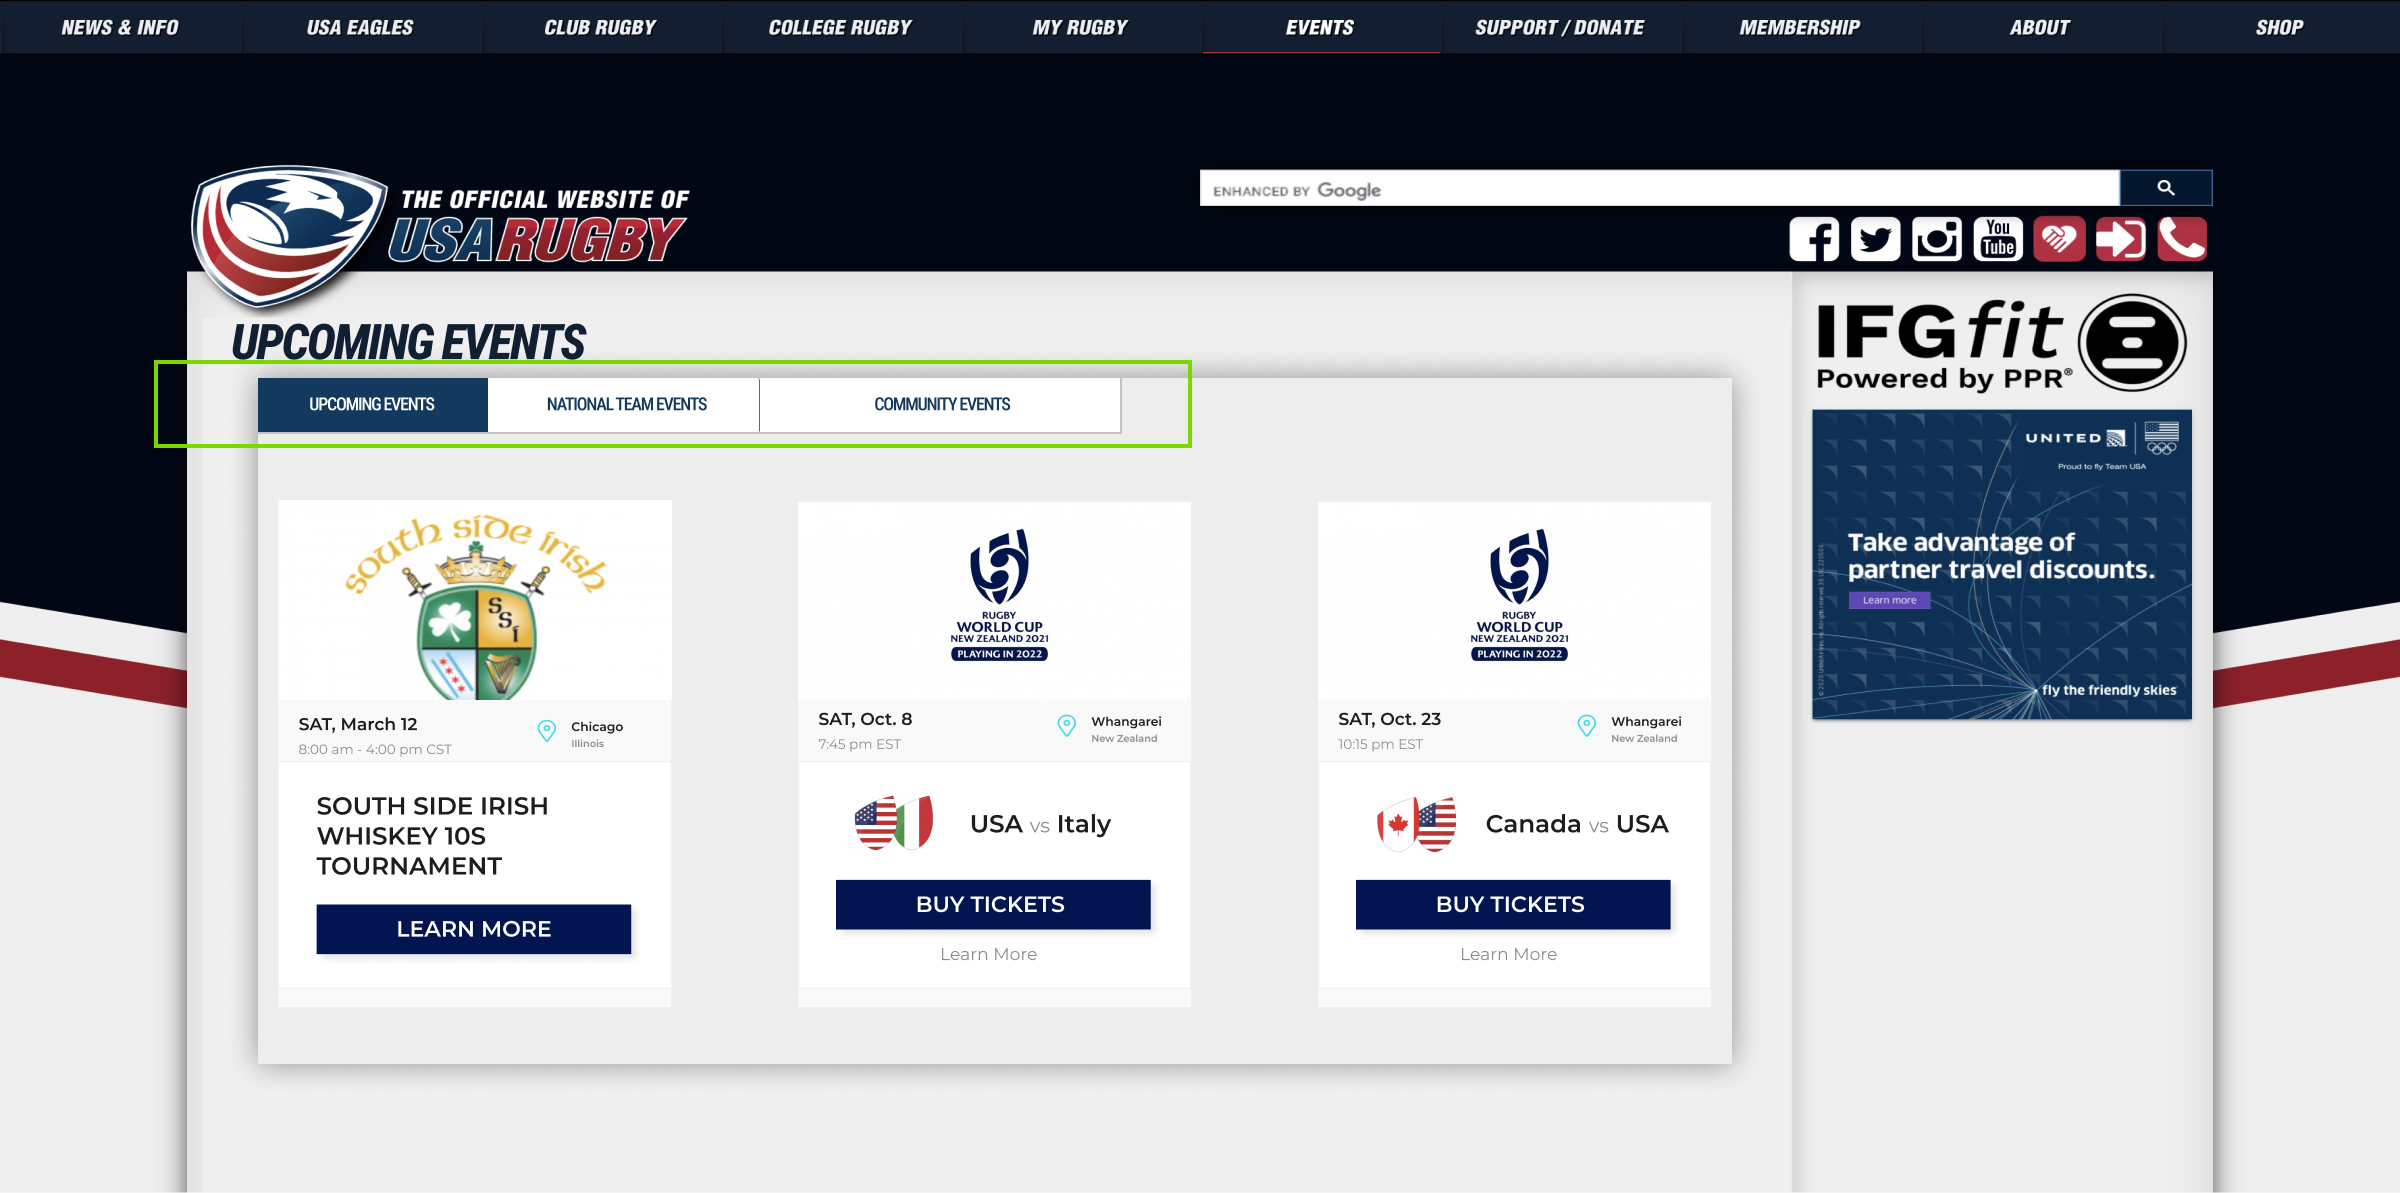
2. Use filter tabs on Upcoming Events page
Based on the click maps & Scroll map results, users are attempting to click on the event filters within /tickets/ although many contain no results.
We recommend to use filter tabs, which will allow users to sort between National and Community events.
- Providing an option to differentiate the 2 levels of events rather than the 12+ current metadata filters provides more efficient segmentation.
- There are only 15 total events, therefore filtering by metadata requires more effort than simply browsing.
REVISED EVENT PAGE
3. Event Cards Redesign
Because the current event cards don’t have specific date for each event, and the link direct to purchasing tickets is very hard to find, we recommend to redesign the cards.
CURRENT EVENT CARDS
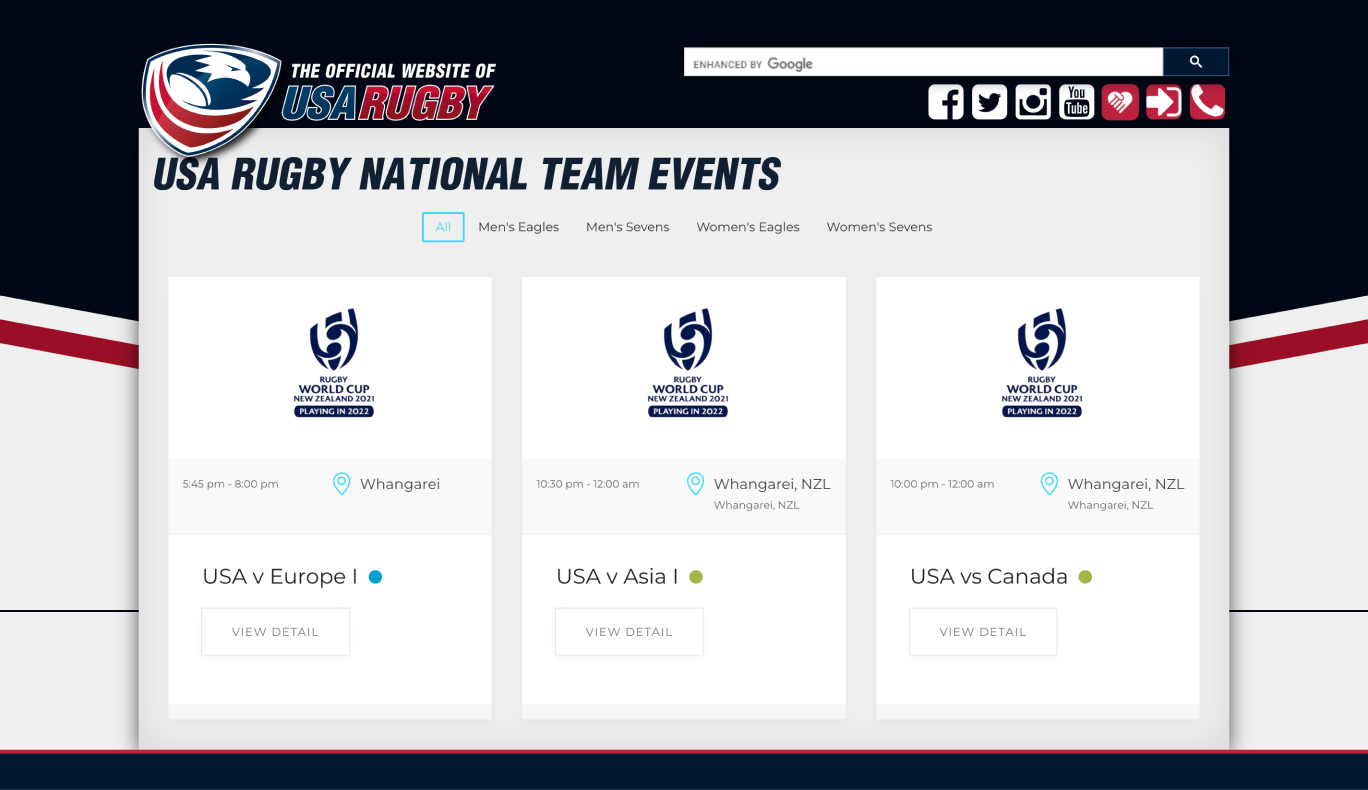
RECOMMEND EVENT CARDS
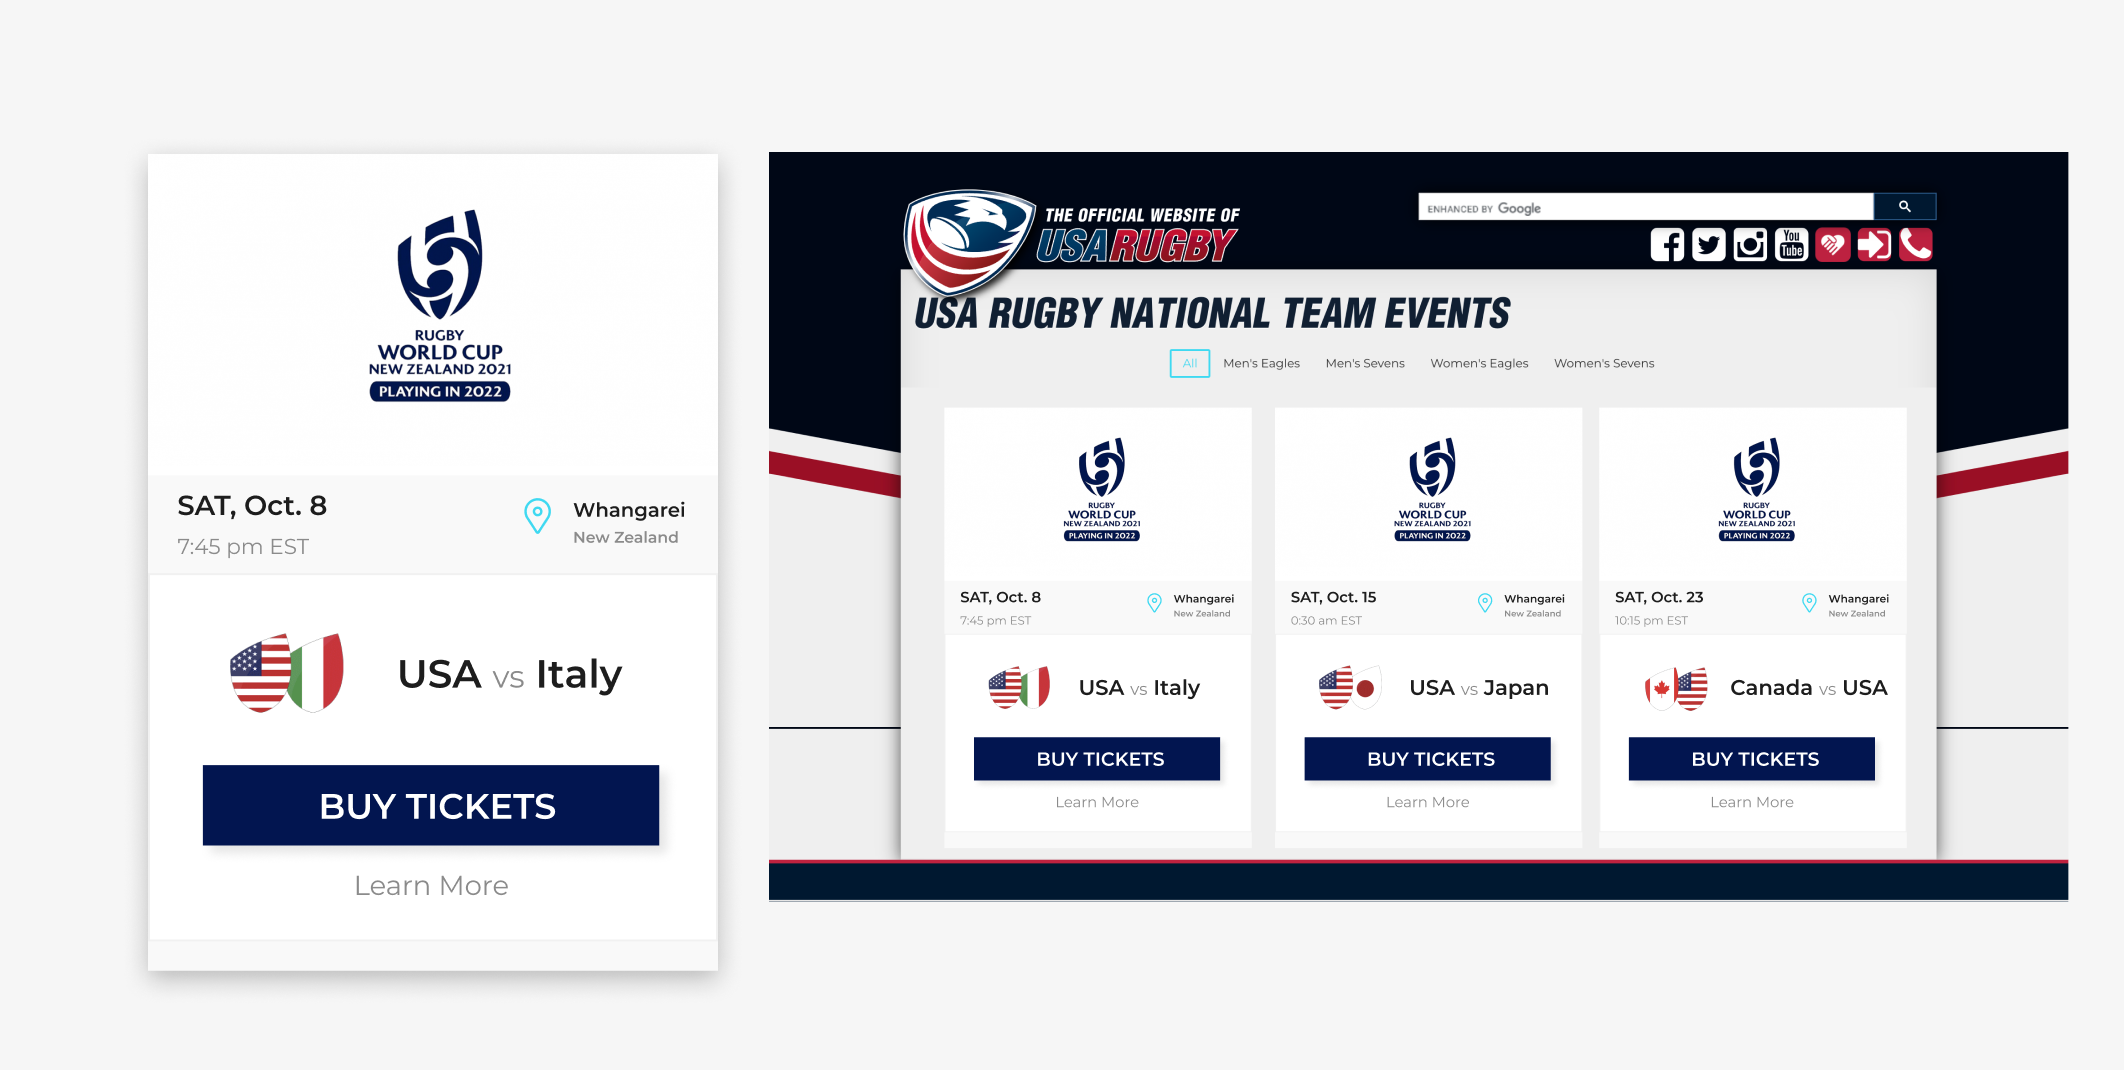
- Providing specific information related to the events will improve users’ experience while browse through the events.
- Having a highlighted ‘Buy Tickets’ button is likely to increase the number of users finding the ticket purchase page, and thus increasing event attendance.
OUTCOMES
THE CLIENT WAS VERY SATISFIED WITH OUR FINDINGS
The client was satisfied with our findings and recommendations. They thought it was really impressing to see all the maps and data visualized how users interact on the website. They liked our design mock-ups very much and were very excited to see the change becoming real.

NEXT STEP
A/B TESTING
We plan to conduct an A/B Testing for the newly designed navigation bar.
The Testing is aimed to improve the discoverability of the Events/Tickets page to increase exposure to upcoming events.
We assume that by making the change, the Events/Tickets page will experience increased page views.
Metrics:
Pageviews of the Events/Tickets page
Audiences:
No restrictions; this test is for any user who wants to explore upcoming events.
Test Splits:
50/50
